Graphing SNAT collisions with a NetDevOps approach
Apr 13, 2024
Apr 13, 2024
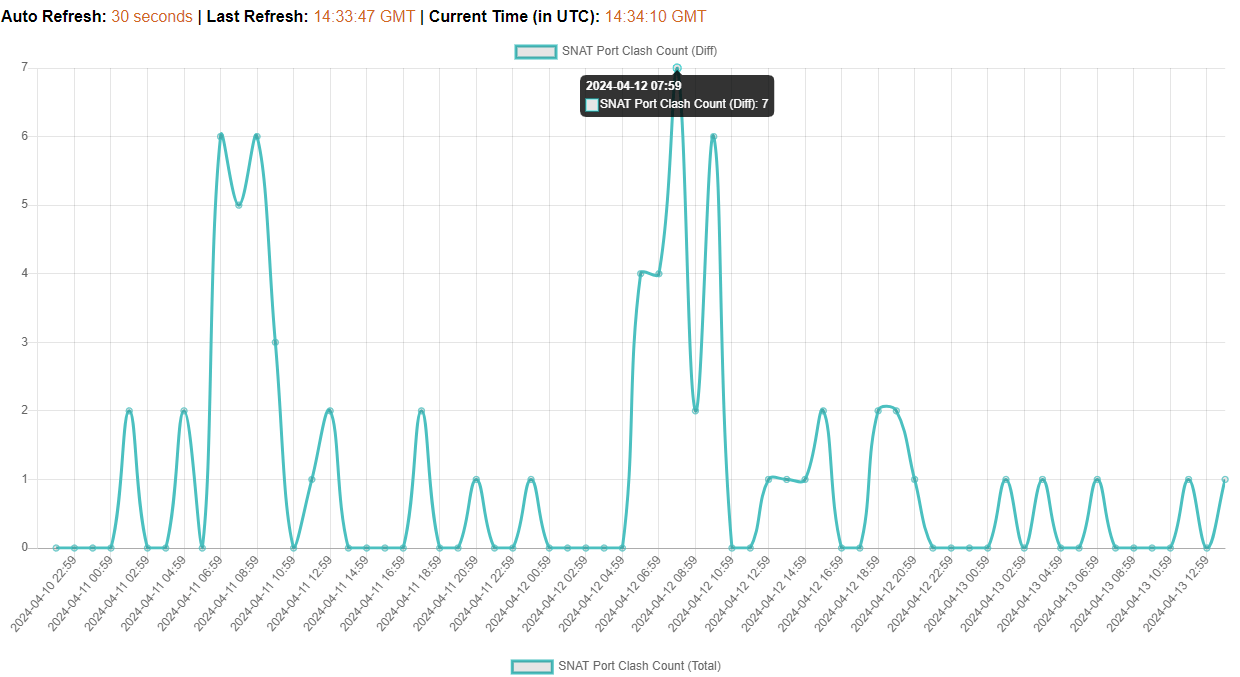
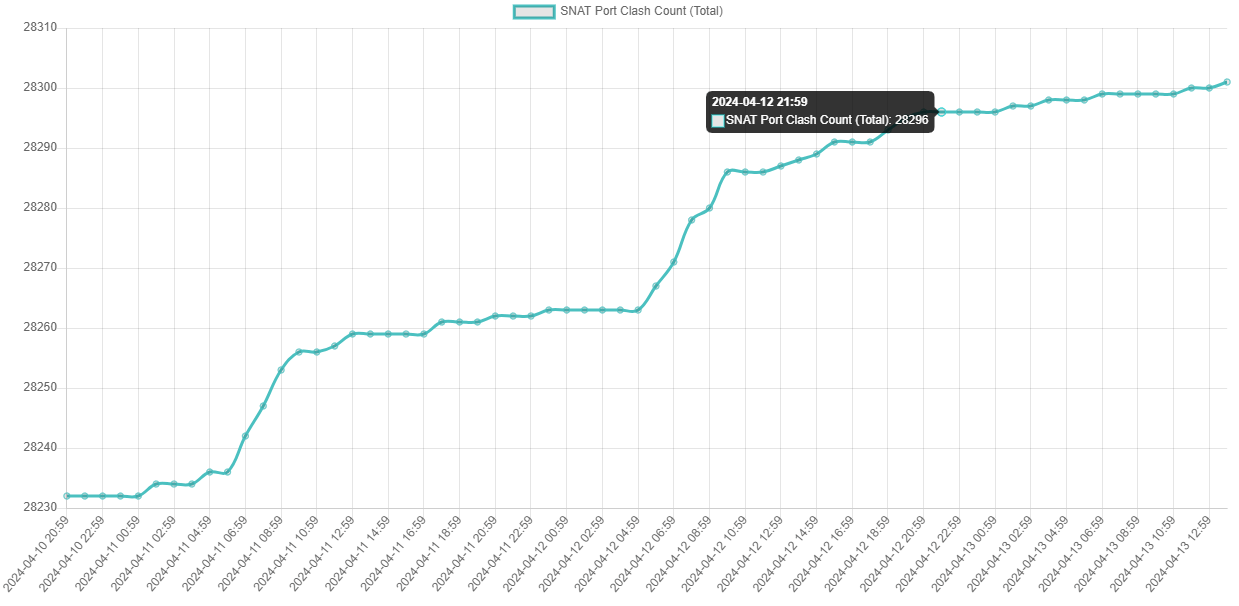
This is a walkthrough of a real customer scenario with a suspected NAT Port Exhaustion issue with their Azure-hosted FortiGate Fortinet Firewall setup, using a NetDevOps approach to overcome limited availability of observability tooling while they are mid-migration in a long-running programme. The desired outcome is to periodically (hourly) take the output of the diagnose sys session stat command to determine whether a NAT port is exhausted on a FortiGate and create two time-series graphs:
Working backwards (because moonwalking is the one true path to Systems Design), the below are the output graphs as rendered in a web browser which are set to refresh every 30 seconds for a NOC-style pane of glass with a dirty little <meta http-equiv="refresh"... tag:
Here's a schematic of what we're aiming for overall before we dive into the details:

The Fortinet FortiGate Firewall (or "Fortinet" from now on, as I'm too FortiLazy to type all that) is on-premises (on-prem) and has Internet connectivity. To recap, we need the following to happen on the Fortinet to exfiltrate the required SNAT Collision counter:
diagnose sys session statFortunately, Fortinet has a handy built-in cron-like feature called Automation Stitches, a framework consisting of Triggers and Actions that allows us to construct the following:
POST to our Internet-facing Azure Function (more on that later)You can configure this through the GUI or CLI, but I'm too lazy to screenshot the UI so here's a walkthrough of the CLI used to achieve this:
cron-like hourly Trigger to invoke at 59 minutes-past each and every hour:config system automation-trigger
edit "Hourly"
set trigger-type scheduled
set trigger-frequency hourly
set trigger-minute 59
next
end
diag sys... command and retrieve the current SNAT Collision counter value:config system automation-action
edit "diagnose system session stat"
set action-type cli-script
set script "diagnose sys session stat"
set accprofile "super_admin"
next
end
POST to our Azure Function:config system automation-action
edit "SNAT_Clash_WebApp"
set action-type webhook
set protocol https
set uri "snatcountapp.azurewebsites.net/api/HttpTrigger1"
set http-body "%%results%%"
set port 443
next
end
config system automation-stitch
 edit "SNAT_Clash_WebApp_SendLog"
  set description "Send to Azure Function to graph SNAT Collisions"
  set trigger "Hourly"
  config actions
   edit 1
    set action "diagnose system session stat"
    set required enable
   next
   edit 2
    set action "SNAT_Clash_WebApp"
    set required enable
   next
  end
 next
end
Check in the UI these are running under Security Fabric -> Automation, and if you want to trigger it immediately and not wait until 59-past the current hour, simply edit the Hourly trigger to about 2 minutes in the future and hammer save and apply quickly enough before time moves on.
ProMode: Set it to only 1 minute away from now if you want an adrenaline rush for the day
It's worth decomposing the elements in Azure and how they tie together before jumping into each. The rough idea is to have a push and a pull with the Azure Table NoSQL Database acting as the glue in between the two:
HttpTrigger1 (don't hate the playa', hate the default name) to provide the FaaS computesnatcount (a sub-service within Azure Storage Account snatcountapp) to provide the NoSQL key:value databasesnatapp (a sub-service within Azure Storage Account snatcountapp) to provide Web Hosting for the HTML/CSS graph visualisation frontendLet's dive into how this all ties in together to help the Network Admin visualise those SNAT Collision count values over time.
First we need to bootstrap an Azure Function running Python 3.8+ in the Azure Portal (or if you prefer, use VS Code and the Azure Extension; or if you hate yourself and need to beat that happiness out, use the Azure CLI command line tools). Ensure you use the v1 Azure Python Programming Model, because the v2 programming model doesn't actually support Function Binding to Azure Tables yet (thanks for that Billy G, I want those wasted hours back plz).
Once complete, you'll need some sweet, sweet Python code to add to __init__.py- as below:
import logging
import json
import datetime

import azure.functions as func

def main(req: func.HttpRequest, message: func.Out[str]) -> func.HttpResponse:
    # Capture to log for debug purposes
    logging.info(req.get_body())
    # Extract Fortinet "clash" value from "dia debug"  output
    snat_clash = str(req.get_body().splitlines()[3]).split("clash=")[1][:-1]

    # Generate unique row key and add SNAT Clash as row
    data = {
        "Value": snat_clash,
        "PartitionKey": "1",
        "RowKey": datetime.datetime.now().strftime("%Y-%m-%d %H:%M")
    }

    # Add as new record in Azure Tables via Function Binding
    message.set(json.dumps(data))
    return func.HttpResponse(snat_clash)
We'll need to come back and add the Function Binding to the function.json file after we've created the Azure Storage Bucket later on, but for now it's worth looking at the Fortinet diag sys... command payload that will be passed in so we can explain what this world class shoddy Python code does:
########## script name: autod.66, offset: 917##########
========= #1, 2024-04-13 15:59:21 ==========
DC-FORTI-01 diagnose sys session stat
misc info:     session_count=43813 setup_rate=221 exp_count=1031 reflect_count=0 clash=28301
    memory_tension_drop=0 ephemeral=0/4423680 removeable=0 extreme_low_mem=0
    npu_session_count=0
delete=108, flush=18, dev_down=73/7143
session walkers: active=0, vf-1974, dev-60, saddr-0, npu-0
TCP sessions:
     1031 in NONE state
     23343 in ESTABLISHED state
     12 in SYN_SENT state
     10 in FIN_WAIT state
     695 in TIME_WAIT state
     473 in CLOSE state
     6286 in CLOSE_WAIT state
firewall error stat:
error1=00000000
error2=00000000
error3=00000000
error4=00000000
tt=00000000
cont=00000000
ips_recv=1d065adb
policy_deny=0beaaf7c
av_recv=00000000
fqdn_count=00000264
fqdn6_count=00000000
global: ses_limit=0 ses6_limit=0 rt_limit=0 rt6_limit=0
======= end of #1, 2024-04-13 15:59:21 ======
The first thing you might notice if you're a Fortinista (that's what you folk call yourself, right?) is those extra lines with ###... and ===... that are injected by Automation Stitches at the beginning and end of the usual diag sys... output, which wouldn't usually be there. This pushes the line count up by one from where the clash=... value that we're interested in obtaining sits, which helps explain the [3] in this portion of the Python script:
snat_clash = str(req.get_body().splitlines()[3]).split("clash=")[1][:-1]
There's a lot going on in that one-liner (I can hear the groans of my team already - "PEP8, PEP8 man!"), so let's decompose some important parts:
| Code | Outcome |
|---|---|
str(req.get_body()) |
Convert the HTTP POST bytestream into a string (read: "stop pesky type conversion errors") |
.splitlines()[3] |
Split the HTTP POST data by new line carriage returns (\n in raw bytestream output) and get the 4th line (Python line numbering starts at 0, hence it being [3]) |
.split("clash=")[1] |
Split the result of this (4th line of text) by the phrase clash= and get the 2nd part of this split (first part, part 0, would be text clash= itself; second part, part 1, is the number after the equals symbol - so 28301) |
[:-1] |
Get rid of a pesky invisible trailing whitespace character at the end with a Python string slicing trick to remove -1 characters |
All of which results in the actual value we care about, the SNAT Collision count - namely: 28301.
Although that's the only value we care about, I did say this was a time-series graph, so while we have the series we don't have the time - which is effectively whatever the current date and time is. Azure Tables works with JSON as its CRUD language, so now we need to construct a JSON payload to give it to add the NoSQL key:value pairings as a new database record:
# Generate unique row key and add SNAT Clash as row
    data = {
        "Value": snat_clash,
        "PartitionKey": "1",
        "RowKey": datetime.datetime.now().strftime("%Y-%m-%d %H:%M")
    }
Azure Tables mandate two types of key:value pairs to be specified per row record whether we like it or not:
PartitionKey - Effectively used to shard the data across multiple elements of the underlying compute that processes Azure Tables reads and writesRowKey - Effectively used to create a unique key similar to a Primary Key per database row entryI'm a big fan of minimalism, so while we could arbitrarily set something for both these and then add key:value pairs for the two pieces of data I want to collect (the current date/time and the current SNAT Collision count), that's not how I sausage roll. We're not exactly webscale here, so sharding (and the performance gains that come from this approach) isn't something I want to worry about, so I'll set the PartitionKey to a constant value of 1 each time, which also will make the later retrieval via HTTP API call far easier than trying to remember whatever sharding logic I came up with and having to duplicate this in the JavaScript that will run the frontend graph visualisation.
Ditto, minimalism means I only have two values I care about, and I know one will be unique anyway by definition (the date/time element - because if I could control time and go arbitrarily back or forwards in it, I'd be sat on my billionaire yacht right now) - so let's go ahead and bung that in the mandatory RowKey but format it into something like 2024-10-01 10:15 (that's why M/D/Y format sucks, my American friends - "Is that the 10th of January or the 1st of October?" I don't hear you cry) field.
Last but not least, the money-maker - so the only additional field we'll need is the one to represent the processed SNAT Collision count value, which I've arbitrarily called Value - but unlike the other two (RowKey and PartitionKey) - is within my gift to name, so I could have gone all bob or jane or maybe pablo on it, but those are confusing (albeit cool, especially the last one - no offence Bob's and Jane's of the world).
Processing done, we now save this to the Azure Table through a Function Binding approach, where Azure allows you to access as if being a typical Python variable or object that you can just update the Azure Table as if it was an input to your function, which I've called message but called have just as easily called bob, jane or somethingelse:
def main(...message: func.Out[str]) -> func.HttpResponse:
    ...
    # Add as new record in Azure Tables via Function Binding
    message.set(json.dumps(data))
    ...
Azure Table Storage is a practically-free offering from Azure that's a) perfect for simple key:value stores and b) plays into my minimalist approach to Azure Resource creation, because it's a sub-service of the Azure Storage Account I'm going to have to create to host my HTML/CSS graph visualisation file to the world anyway - so means I only have 1x Azure Resource in my Azure Account/Portal (Azure Storage Account snatcountapp) which represents two functional elements - a web hosting function (sub-service Azure Storage Container snatapp) and a database function (sub-service Azure Table snatcount).
There's not really much to the definition of a new Table which is covered well in the Azure Table quickstart, but you will need to define an Entity with new type Value as a string via the Storage Browser in the Azure Portal, as per the screenshot below, before you can start writing to it:

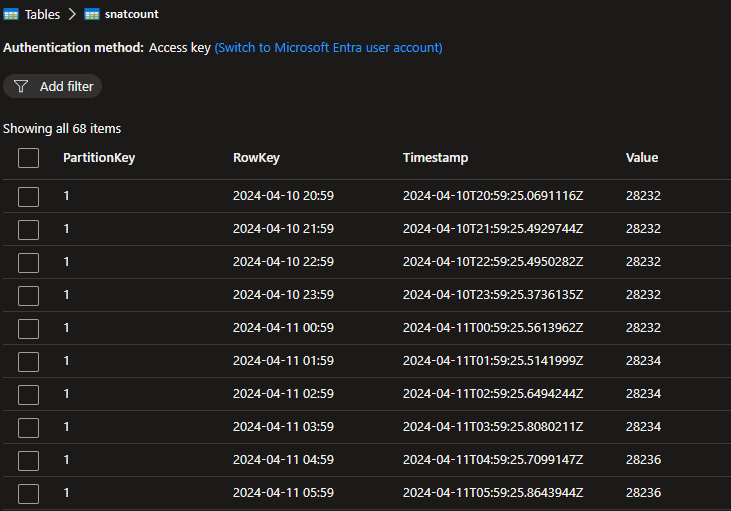
Here's what the key:value database records will look like as they collect over time; note that I didn't specify or create the Timestamp field, it's another mandatory field in Azure Tables that's automagically populated for you:
While we're here, we'll need to create a Shared Access Signature (SAS) key following the typical Portal-led process with the following specific permissions, namely:
| Permission Name | Selection(s) |
|---|---|
| Allowed services | Table |
| Allowed resource types | Container, Object |
| Allowed permissions | Read, List |
Make sure you set a fairly lengthy expiration date/time, otherwise you'll be back here before you know it updating the SAS Key. Once done it should look something like this before pressing Generate SAS and connection string:

Ensure you make a note of your SAS token, which will look something like this:
?sv=2022-11-02&ss=t&srt=co&sp=rl&se=2025-04-13T13:07:03Z&st=2024-04-13T23:07:03Z&spr=https&sig=...
The way SAS works is that this becomes a URI parameter in the HTTP API request, so we'll end up swapping the ? (question mark) with an & (ampersand) to combine it with other URI parameters within the JavaScript AJAX request later on.
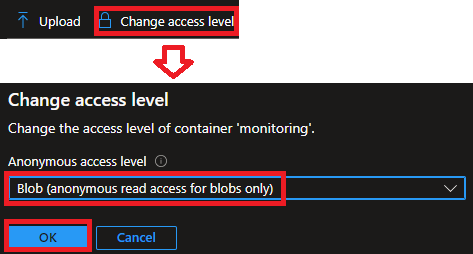
All we do here is:
snatapp and upload our HTML/CSS files to itAccess Level to allow Blob (anonymous read access for blobs only) (i.e. allow it to be accessed from the Public Internet, as Storage Buckets are private by default)function.jsonYou'll end up with something like this in the Azure Portal for the access permissions:
Because Blobs and Buckets follow a global and formulaic URL structure, once you've uploaded the HTML/CSS artefacts (as per below) you can now test this immediately by going to:
https://{azure_storage_account_name}.blob.core.windows.net/{azure_storage_container_name}/graph.html
Where you need to replace {azure_storage_account_name} with the name you chose when you created the Azure Storage Account and {azure_storage_container_name} with the name you chose for the Container within the Azure Storage Bucket. For me that looks like:
https://snatcountapp.blob.core.windows.net/snatapp/graph.html
Here's the files we'll end up having uploaded into the Bucket:

This is the icon that appears next to a website's URL in your web browser tab or address bar, and you can easily pick your favourite from favicon.io or a myriad of other Favicon Generators. Just ensure the .ico file is the one you upload, the others aren't required for this Web App (but might be if we wanted it to go in an App Store or look different when saved on the App Launcher screen of an iPhone or Android device or... but we're not Web Developers here, so the stock favicon.ico will do nicely).
There's going to be a lot happening in the following HTML/CSS file, with some JavaScript and AJAX (yes it says "XML" in the acronym, but really it means "JSON", trust me - XML used to be cool, and naming things is hard) so stick with it:
<!DOCTYPE html>
<html>
 <head>
  <title>SNAT Count Tracker</title>
  <style>
  body {
   font-family: sans-serif;
  }
  h1 {
   font-size: medium;
  }
  span {
   font-weight: normal;
   color: chocolate;
  }
  </style>
  <meta http-equiv="refresh" content="30">
  <link rel="icon" href="/snatapp/favicon.ico" type="image/x-icon" />
 </head>
 <body>
 <script src="https://cdnjs.cloudflare.com/ajax/libs/moment.js/2.24.0/moment.min.js"></script>
 <script src="https://cdn.jsdelivr.net/npm/chart.js@2.8.0"></script>
 <script src="https://ajax.googleapis.com/ajax/libs/jquery/3.7.1/jquery.min.js"></script>
 <script type="text/javascript">
 $(async function() {
  // Get Azure Table NoSQL values
  const response = await fetch('https://snatapp.table.core.windows.net/snatcount?$format=json&{insert_your_sas_token}}');
  const data_json = await response.json();

  // Remap SNAT Count JSON to get delta value only (increment between current and previous hour's value)
  const data = [];
  for (let i = 1; i < data_json['value'].length; i++) {
    if(parseInt(data_json['value'][i]['Value']) > parseInt(data_json['value'][i-1]['Value'])) {
      snat_diff = (parseInt(data_json['value'][i]['Value']) - parseInt(data_json['value'][i-1]['Value']));
    } else {
      snat_diff = 0;
    }
    data[i] = {'RowKey': data_json['value'][i]['RowKey'], 'Value': snat_diff};
  }

  // Set refreshed timestamp to screen
  $('#refreshtime').text(new Date().toUTCString().slice(-12));

  // Update Current Time to screen
  $('#currenttime').text(new Date().toUTCString().slice(-12));
  setInterval(function(){
   $('#currenttime').text(new Date().toUTCString().slice(-12));
  }, 1000);

  // Update Total Chart
  const ctx_a = document.getElementById('chart-total').getContext('2d');
  const totalChart = new Chart(ctx_a, {
    type: 'line',
    data: {
      labels: data_json['value'].map(item => item.RowKey),
      datasets: [{
        label: 'SNAT Port Clash Count (Total)',
        data: data_json['value'].map(item => item.Value),
        borderColor: 'rgb(75, 192, 192)',
        fill: false
      }]
    },
    options: {
      scales: {
        x: {
          type: 'time',
          time: {
            unit: 'day'
          }
        },
        y: {
          beginAtZero: true
        }
      }
    }
  });

  // Update Diff Chart
  const ctx_b = document.getElementById('chart-diff').getContext('2d');
  const diffChart = new Chart(ctx_b, {
    type: 'line',
    data: {
      labels: data.map(item => item.RowKey),
      datasets: [{
        label: 'SNAT Port Clash Count (Diff)',
        data: data.map(item => item.Value),
        borderColor: 'rgb(75, 192, 192)',
        fill: false
      }]
    },
    options: {
      scales: {
        x: {
          type: 'time',
          time: {
            unit: 'day'
          }
        },
        y: {
          beginAtZero: true
        }
      }
    }
  });
 });
 </script>
 <h1>Auto Refresh: <span>30 seconds</span> | Last Refresh: <span id="refreshtime"></span> | Current Time (in UTC): <span id="currenttime"></span></h1>
 <canvas id="chart-diff"></canvas>
 <canvas id="chart-total"></canvas>
 </body>
</html>
Save this file as graph.html (or frankly, whatever you want with a .htm or .html extension). You then need to upload this to your Azure Bucket as per the steps earlier for favicon.ico.
You'll need to replace {insert_your_sas_token} on line 31 with the SAS token you generated earlier without the leading ? - so for instance it (your line 33 in graph.html) might end up looking like:
const response = await fetch('https://snatcountapp.table.core.windows.net/snatapp?$format=json&sv=2022-11-02&ss=t&srt=co&sp=rl&se=2025-04-13T13:07:03Z&st=2024-03-27T23:07:03Z&spr=https&sig=...');
The resulting HTML page is now accessible at https://snatcountapp.blob.core.windows.net/snatapp/graph.html or the respective equivalent for whatever you named your Azure Storage Account and Azure Bucket as.
A full explanation of how all this works would take a while and it's worth doing a crash course in HTML, CSS and JavaScript if this floats your div boat (that's a WebDev joke, I... ok... yeah...), but some callouts are:
await a promise (read: a fetch), the next line of JavaScript carries on executing against nothing because the fetch never got it's content back yet
await the result before you can process itmeta tag, not because of any JavaScript gubbins:
<meta http-equiv="refresh" content="30">.svg image in Notepad and surprise yourself[i]) against the previous value ([i-1]), and
data0 to rebase the graph at the base axis flatline (i.e no change since last value)// Remap SNAT Count JSON to get delta value only (increment between current and previous hour's value)
const data = [];
for (let i = 1; i < data_json['value'].length; i++) {
if(parseInt(data_json['value'][i]['Value']) > parseInt(data_json['value'][i-1]['Value'])) {
snat_diff = (parseInt(data_json['value'][i]['Value']) - parseInt(data_json['value'][i-1]['Value']));
} else {
snat_diff = 0;
}
data[i] = {'RowKey': data_json['value'][i]['RowKey'], 'Value': snat_diff};
}
Finally, we need to update the Azure Function to add the Function Binding so that the Azure Function can talk, or "bind" to the Azure Table without need for a pesky API Gateway or some other glue. Two things are required to achieve this:
bindings section within function.json, inside the Azure Function HttpTrigger1 that references an Azure Storage Access Key Connection String:{
"bindings": [
{
"name": "message",
"type": "table",
"tableName": "snatapp",
"partitionKey": "1",
"connection": "TEST_BUCKET",
"direction": "out"
},
...
App setting within the Environment variables section of the Azure Function App as documented in Azure Function App work with application settings, in a new environment variable as follows:| Name | Value |
|---|---|
TEST_BUCKET |
{your_azure_storage_account_connection_string} |
Below is my example Environment Variables as defined within my Azure App Function, note all the other non-highlighted ones are essentially defaults that come with the Azure Function itself:
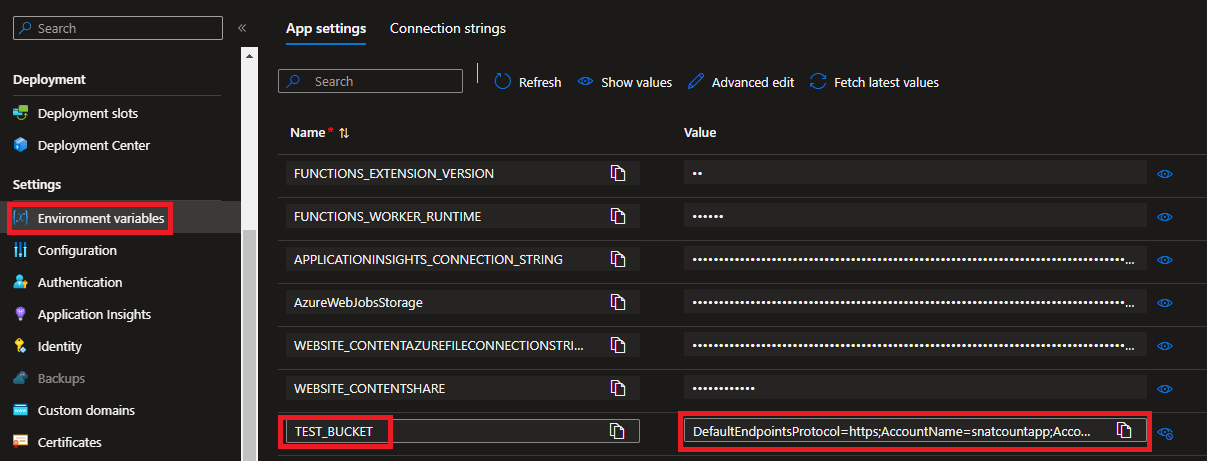
Don't forget to click
Applyat the bottom of the page to save your new variable, otherwise it's not obvious in the Azure Portal that it hasn't actually saved
As there is quite a lot to digest here, I've tried to compile all the code, artefacts and pieces together in a cohesive GitHub repo here:
I can't really call it NetDevOps without the standard IaC component of DevOps, so I'll try and come back in future and add some Terraform runbooks to string the creation of this altogether - although frankly this is more of a learning exercise and a quick way to hack your way out of not having access to some observability tooling like Splunk, Grafana or Prometheus.
So if you're thinking of deploying this in Production, have a rethink if you can't just deploy - or use - one of those instead.
Or don't and have fun hacking 😄.